Ask a shopper how they bought their last keyboard and you will get a tidy story: I needed one, I looked at a few, I picked this one. We metered 731 of them instead. The median gaming buyer looked at thirteen product pages before deciding. One looked at a hundred and twenty-one. Nobody remembers a hundred and twenty-one product pages, and nobody would ever claim them.
That gap is the whole argument for passive clickstream metering, and it is worth being precise about what the method actually is, what it can prove, and where it stops being honest. This is a working note on all three, using a recent US path-to-purchase study for a global PC and gaming peripherals manufacturer as the example.
What the method is
A metered panel agrees to have their browsing logged. No tasks, no scenarios, no simulated store: they shop the real internet, on their own devices, for as long as they normally would. What we receive is a raw stream of visited URLs with timestamps.
On its own that stream is close to useless. The work is in three steps that turn it into a journey.
Validation. A log only enters the sample if it contains at least one genuine category action, a category search or a category navigation. In this study that meant a defined list of brand and category search strings, from brand names through to mechanical keyboard, ergonomic mouse and gaming mousepad. Everything else is browsing, not shopping, and it stays out.
Classification. Every surviving page is typed. Is it a product page, a category page, an on-site search, a search engine result, a social platform, a community thread, an AI assistant? Which brand does it belong to, and which product cluster? This study tracked 49 brands across mice, keyboards, headsets, webcams and sim gear.
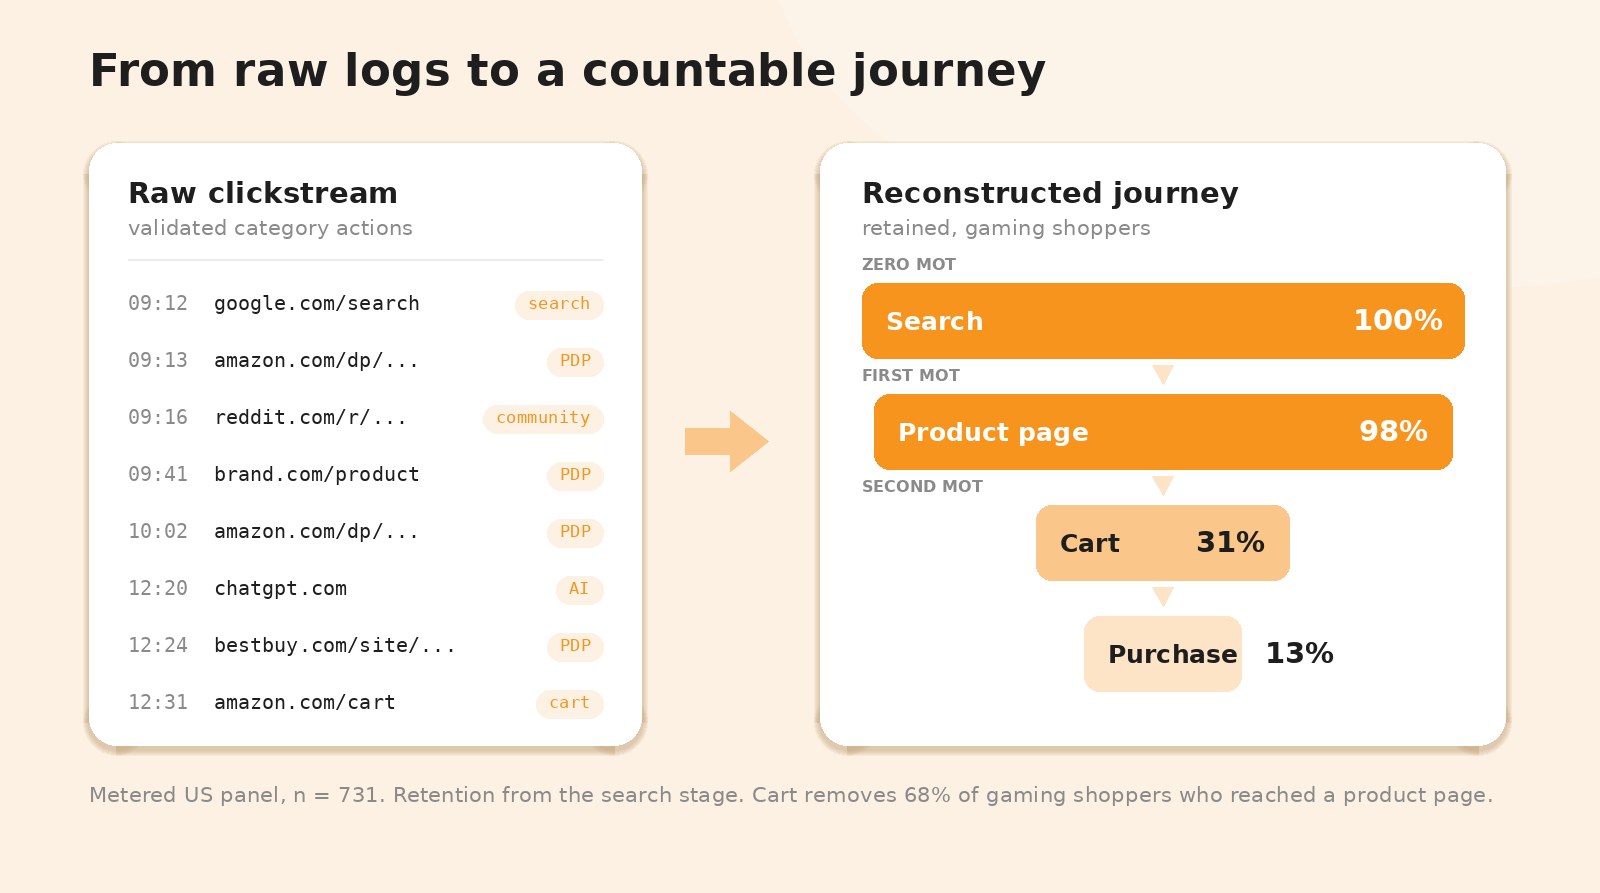
Reconstruction. The typed pages are then stitched back into one journey per person, in order, with the time between them intact. That ordering is what converts a page list into behaviour: you can now see what came first, how long each stage took, and where the person stopped.
The frame: four moments of truth
Journeys get mapped onto four stages, which is old shopper-marketing vocabulary put to a new use. Zero is search and discovery. First is the product page. Second is cart and checkout. Ultimate is what happens afterwards: support queries, modifications, reviews, recommendations.
The value of the frame is not that it is clever. It is that it is countable. Because every journey passes the same four gates, you can measure how many people survive each one.
| Moment of truth | Gaming: retained | Productivity: retained |
| Search (Zero) | 100% | 100% |
| Product page (First) | 98% | 98% |
| Cart (Second) | 31% | 17% |
| Purchase | 13% | 8% |
Read down that column and the category's real problem announces itself. Search converts to a product page almost perfectly. Then the cart removes two thirds of gaming shoppers and five sixths of productivity shoppers. Across individual brands, between 93% and 99% of product-page visitors never added to cart at all.
That finding is unremarkable to state and impossible to obtain by asking. No shopper reports the eleven products they considered and abandoned. They report the one they bought.
What gets measured
Nine metrics come out of the reconstructed journeys, and they divide cleanly into three families.
Engagement: platform reach, share of research time per platform, and category entry points, meaning the frequency of each trigger that starts a search.
Conversion: stage drop-off, purchase conversion lift after a given platform visit, and the recruitment window, the elapsed days from a shopper's first signal to their purchase.
Influence: AI tool involvement, advocacy within 90 days, and competitor cross-shopping, the share of a brand's shoppers who also opened a rival product page in the same session.
The last of those is the one clients tend to underestimate. Self-reported consideration sets are notoriously generous and notoriously wrong. Metered cross-shopping is neither: in this study, roughly half of the client's gaming searchers also searched a single named rival, and the competitive set visibly narrowed as shoppers moved from search to product page and committed.
Four things the method caught that a questionnaire would not
Time, in days rather than adjectives. Gaming keyboards averaged 21 days from first signal to purchase; productivity mice averaged 5, and just 1 day from the first category-specific signal. Same category, same shopper, two completely different buying rhythms. One needs a nurture strategy. The other needs to be in stock and easy to reorder. You cannot infer that from a claimed importance scale.
Depth, in pages. A median of 13 product pages before a gaming purchase against 4 before a productivity purchase. Research time before checkout ran 42 minutes for gaming keyboards and 24 for productivity mice. Depth of research turned out to segment this category better than any demographic in the sample.
Triggers, in their own words. Because the logs contain real search strings, entry points can be read rather than hypothesised. They sorted into seven, led by next-generation launch anticipation (21%), outright device failure and wear (19%) and performance bottlenecks (16%), with physical discomfort and health at 12%. And the strings themselves carry the detail that makes them usable: a whole sub-trend of shoppers buying replacement wireless dongles, not because they wanted new hardware, but to revive a device whose receiver they had lost.
New behaviour, before anyone has language for it. AI assistants appeared in the journeys of 85 to 88% of shoppers, and were tied to under 3% of purchases. More interesting was where they appeared: not at discovery, but between the product page and the cart. Around half of AI queries were validation requests, rate this out of ten, be honest, no sugarcoating, and two in five pasted an entire retail listing in for scoring. In the heaviest session, one shopper re-ran the same comparison 46 times, changing one component each time. Survey a shopper about AI and they will tell you whether they approve of it. The logs told us it had become a pre-checkout second opinion.
Where the method stops
Any methodology piece that does not include this section should be read with suspicion.
It sees behaviour, not reasons. Metering tells you that 93 to 99% of product-page visitors did not add to cart. It does not tell you whether that was price, shipping, an out-of-stock line, or a decision to go and buy it in a shop. Behaviour localises the problem; it does not diagnose it. That still needs a follow-up, whether a survey layer or a controlled test.
Content stays closed. We can see that a shopper opened an AI assistant, and how long the session lasted. We cannot read the conversation. AI tool shares in this study were therefore reported as tool reach per unique user, not as share of conversation, and labelled accordingly.
Coverage has holes, and they bias the totals. Mobile metering here covered browser activity only, not in-app activity. Combine that with a category genuinely researched on desktop and you get 74% of research time on PC. Both things are true, and only one of them is a finding. The correct move is to disclose the mechanism rather than to present the number clean.
Base sizes collapse the moment you slice. 731 panelists is a healthy sample. The productivity brand-query cut was 47 queries. Inter-brand comparison searches were 18. The AI-mode analysis rested on 228 queries from 34 shoppers, and one shopper accounted for close to 60% of them. Those are real patterns and they were worth reporting, but as directional signals with the base stated on the slide, never as projectable percentages. A study that reports its thin cuts with the same confidence as its headline numbers is not being thorough, it is being careless.
Advocacy needs a longer window. The ninety-day advocacy metric produced exactly one genuinely vocal user, who turned out to have had a commercial affiliation with a competitor. One data point, correctly labelled as an anecdote. Some behaviours are too rare for a single wave to catch.
When to reach for it
Passive metering and behavioural store testing answer opposite questions, and the failure mode we see most often is using one to do the other's job.
Metering is the right instrument when the question is where and when. Which platforms matter, in what order, over how many days? What triggers entry? Where does the funnel leak? Who else is being considered? It is descriptive, it is unmanipulated, and its authority comes from being real.
A controlled behavioural test is the right instrument when the question is what if. Would this price hold? Would this primary image win the click? Would this claim survive being moved down the gallery? Metering cannot answer any of those, because the thing you want to know about does not exist yet.
Used in sequence they are considerably stronger than either alone. This study's metered funnel identified the cart as the category's cliff and the product page as its single highest-reach touchpoint. It could not say which product page would fix it. That is the next study, and it is a different method.