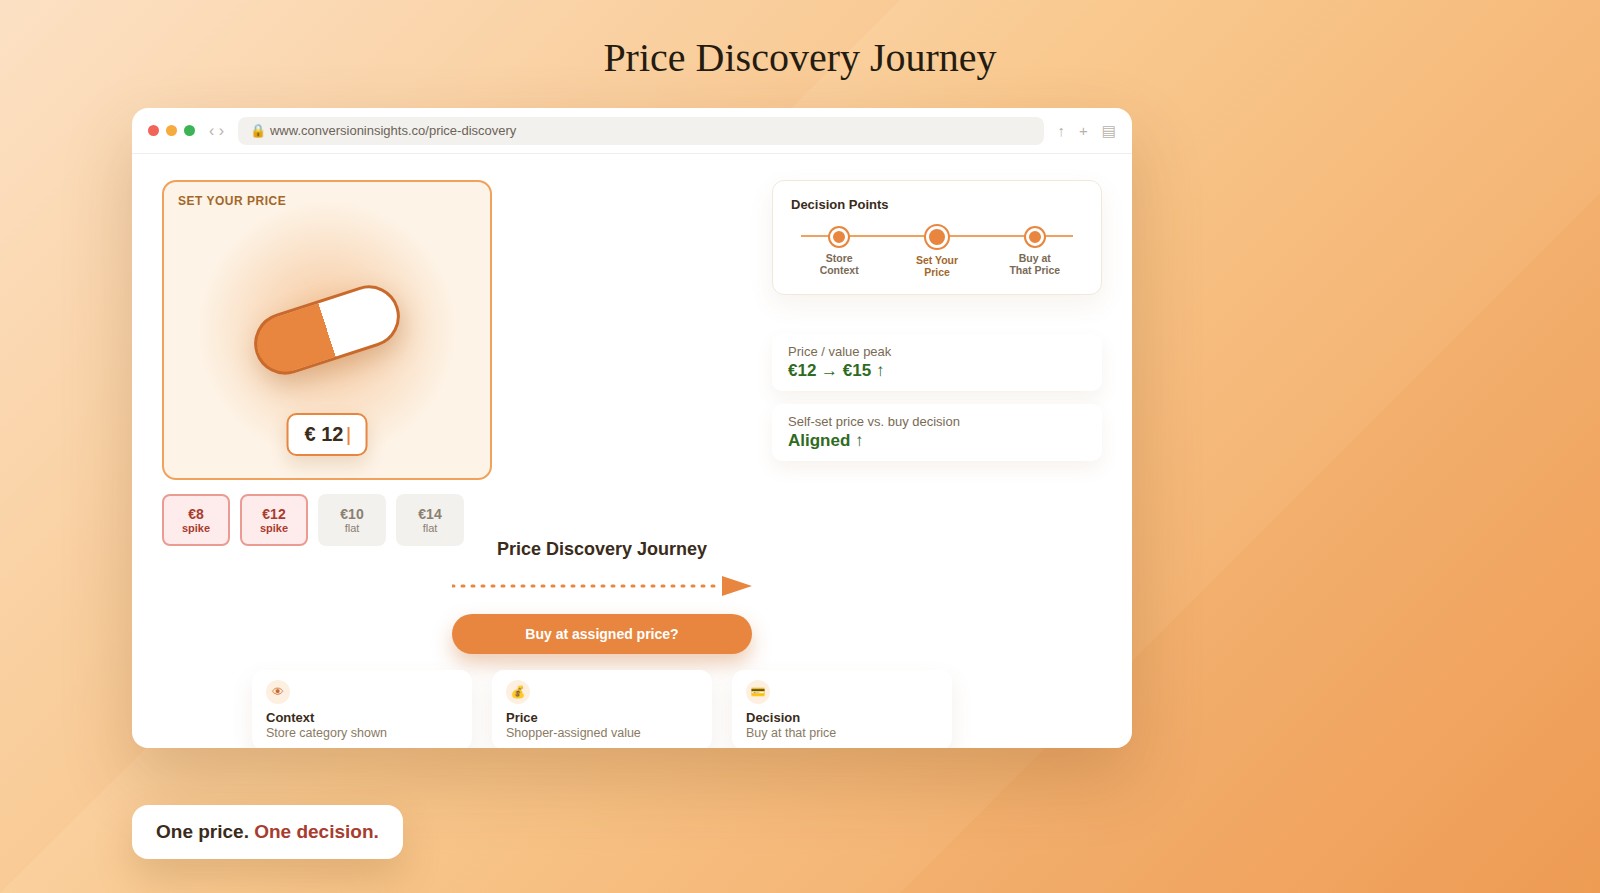
Most pricing research produces a smooth curve: price goes down, interest goes up, then falls away again. Neat, tidy, and almost never what real buyers actually do. In market after market, willingness to pay doesn't move in a straight line. It jumps, sharply, at specific price points — usually because a strong competitor is sitting right there.
Most pricing methods can't see that jump, because of how they ask the question.
Why we don't run Gabor-Granger, PSM or conjoint
Gabor-Granger and price sensitivity meters walk each respondent through a sequence of prices and average the results into a curve. Conjoint goes further and lays options out side by side, asking people to trade price against features directly. Both assume a shopper judges prices calmly and evenly, weighing several at once.
They don't. A shopper looks at one price, on one product, in one moment. And with conjoint specifically, the trade-off is usually obvious enough that respondents can see exactly what's being tested — which invites a rationalized, strategic answer instead of the instinctive one that actually predicts behaviour. Monadic testing is not one technique among several for us; it's the same principle we use to test packaging and product pages, applied to price. One person, one price, one decision.
How we actually run it
When a client already has specific price points in mind, we test each one on its own, monadically, against real market context: one shopper, one price, a real competitive shelf around it.
When they don't have a price yet, we use a two-step version of the same idea. First, we show a shopper a store where every product has a price except the one we're testing. They set that price themselves, based on what the product is worth to them in that context. Then, separately, they decide whether they'd actually buy it — at the price they just set.
Either way, the rule doesn't change: one price, one decision. That's what shows where demand actually jumps, instead of where a curve happens to look smooth.
What that looked like on a real test
We recently ran this on a vitamin D supplement, priced with the two-step method, in two different category contexts: once shelved as a plain vitamin D product, once shelved inside a more specialised category built around one of its other benefits. Same product, same shoppers, different neighbours on the shelf.
The price shoppers assigned it was never a smooth bell curve. In the vitamin D context, the distribution showed clear, statistically distinct spikes at two specific price points. Move the same product into the specialised context, and those spikes disappeared — replaced by a single, different spike further up the price ladder. The shape of demand didn't just shift, it relocated, because the competitors framing the decision had changed.
The second step confirmed it wasn't just talk. We didn't only ask what price felt right, we asked whether people would buy at the price they'd just named. The willingness-to-buy data peaked at the same price points as the self-assigned prices, in both contexts. Shoppers weren't naming a number they'd never act on. They were pricing the product against whatever else was standing next to it, then backing that number with an actual buying decision.
What a smooth curve would have hidden
A Gabor-Granger sequence would have handed us a tidy demand curve and one "optimal" price, smoothing straight over both spikes and losing the fact that they move when the competitive set changes. A conjoint grid would have asked shoppers to trade price against features in a format that all but tells them what's being measured. Neither would have told us that the right price for this product depends on which shelf it's standing on.
That's the point of testing price the same way we test everything else: one shopper, one price, one decision, in the market context that actually exists. It's slower to summarise than a curve. It's also closer to where the money actually is.